Arch Linux Package Cleanup
The Partition Is Too Small
I’m currently typing this on a computer that was initially designed as an experimental file server. The data drives are large, but I installed a very small hand-me-down drive for the OS. And I only allocated 7G of space for the root partition. Disk utilization has been hovering around the high 90s for a long time. Until I swap out the drive, keeping the OS size down is a priority.
Clearing pacman Cache
A key way to offload a partition is to reroute the pacman cache. This is where pacman stores old package versions in case you need to downgrade. Making a change like the following in /etc/pacman.conf moved gigabytes off that problem partition.
#CacheDir = /var/cache/pacman/pkg/
CacheDir = /home/richard/pkg # on a partition with much more available space
I delete old packages regularly. If it’s a package that’s currently installed, I keep two older versions. If the package is not currently installed I drop all old versions.
# Keep only 2 old versions of currently installed packages
sudo paccache -k 2 -vvv -r -c /home/richard/pkg
# Drop all old versions of unused packages
sudo paccache -k 0 -u -vvv -r -c /home/richard/pkg
Disk Usage Display Tools
At some point, you’ll want to move on to cleaning up installed packages that are not needed. There are some nice Arch disk usage display tools available that can help with this.
File-based utilities
Package-based utilities
A few more are listed here.
I wanted to identify packages that are large, and seldom or never used. pacgraph comes pretty close with its slick .svg output, but when one typically has many hundreds of packages installed, the graphical output becomes crowded. And it’s difficult to gauge relative package sizes when the names aren’t adjacent.
Looking for something that would output an easily sortable list, I ran into this thread. Users were querying pacman and processing the output using Python or awk. falconindy then brings up his recently created expac. This tool queries pacman’s alpm database. The proposed usage turns out to be a quick way to sort installed packages by size. And it shows the size of the package plus its dependencies, which is even better.
This outputs the size of the package (in bytes) and the name. Very useful.
A Graphical Approach Using expac, R And ggplot2
expac’s output is easy enough to route through ggplot. Here is an R script that sorts the output in descending order and displays the top 25 disk-using packages as a horizontal bar chart.
require(ggplot2)

cmd <- "expac '%m\t%n' | sort -hr"

df <- read.table(text = system(cmd, intern = TRUE), sep = "\t", col.names = c("size", "name"))

ggplot(df[1:25,], aes(x = reorder(name, size), y = size / 1000000)) +
  geom_bar(stat = "identity") +
  coord_flip() +
  ylab("Install Size (MB)") +
  xlab("Package Name") +
  ggtitle("Arch Linux Packages by Installed Size")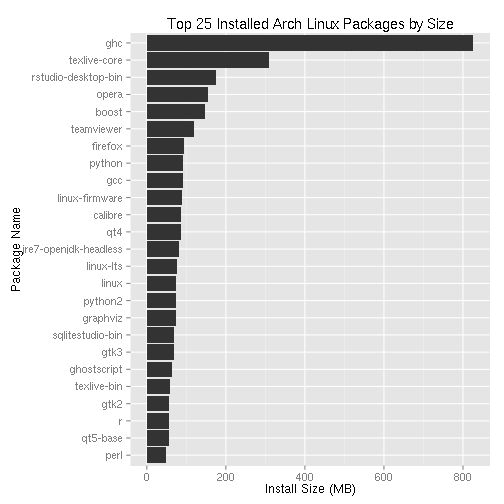
Yes, the Haskell package (ghc) is notable and really is that big.
In any case, the ability to sort and display packages like this seems to hit all the desired points:
- Sorted by descending size, showing the most problematic packages at the top.
- Easy to read package names
- Easy to compare package sizes with neighbors
- Horizontal chart can be modified to show an unlimited number of items without introducing readability problems
I suspect this is just the tip of the iceberg with expac and R. expac offers other useful information that may be useful to see in a graph. For example, how about highlighting packages that are used by other packages?
require(ggplot2)
cmd <- "expac '%m\t%n\t%N' | sort -hr" # Added "required by" field
df <- read.table(sep="\t", text=system(cmd, intern=TRUE))[1:25,]
colnames(df) <- c("size", "name", "requiredby")
df$requiredby.count <- sapply(gregexpr("[a-z0-9\\-]+", df$requiredby), length) # Count package "words"
df[nchar(as.character(df$requiredby)) == 0,]$requiredby.count <- 0 # Zero out miscounts
ggplot(df, aes(x=reorder(name, size), y=size/1000000, fill=factor(ifelse(df$requiredby.count > 0, "Yes" , "No")))) + # Color fill on dependencies
  geom_bar(stat="identity") +
  coord_flip() +
  ylab("Install Size (MB)") +
  xlab("Package Name") +
  ggtitle("Top 25 Arch Linux Packages by Installed Size") +
  labs(fill="Have Dependent Packages") +
  theme(legend.position="bottom")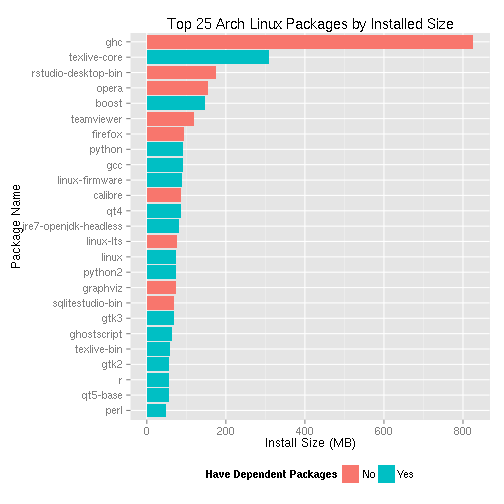
The gregexpr word counting formula is known to fail with lines that start with blanks, so the next line corrects for that.
This graph is interesting. The “No” packages have no other packages depending on them. So these are “apex” packages that I explicitly installed. If I see a “No” program I don’t use any more, it may be a good candidate for deletion.
require(ggplot2)
cmd <- "expac '%m\t%n\t%N' | sort -hr" # Added "required by" field
df <- read.table(sep="\t", text=system(cmd, intern=TRUE))[1:25,]
colnames(df) <- c("size", "name", "requiredby")
df$requiredby.count <- sapply(gregexpr("[a-z0-9\\-]+", df$requiredby), length)
df[nchar(as.character(df$requiredby)) == 0,]$requiredby.count <- 0
ggplot(df, aes(x=reorder(name, size), y=size/1000000, fill=df$requiredby.count)) + # Color fill by package count
  geom_bar(stat="identity") +
  coord_flip() +
  ylab("Install Size (MB)") +
  xlab("Package Name") +
  ggtitle("Top 25 Arch Linux Packages by Installed Size") +
  labs(fill="Dependent Packages") +
  theme(legend.position="bottom")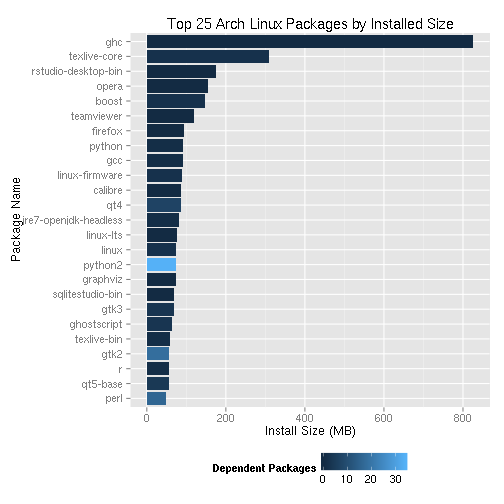
This view shows what packages are dependencies of many other packages, like python2, with 34 dependent packages.
